
Traidy – Strategy Backtesting & News Data Research
Last updated:
Automatically generated image description
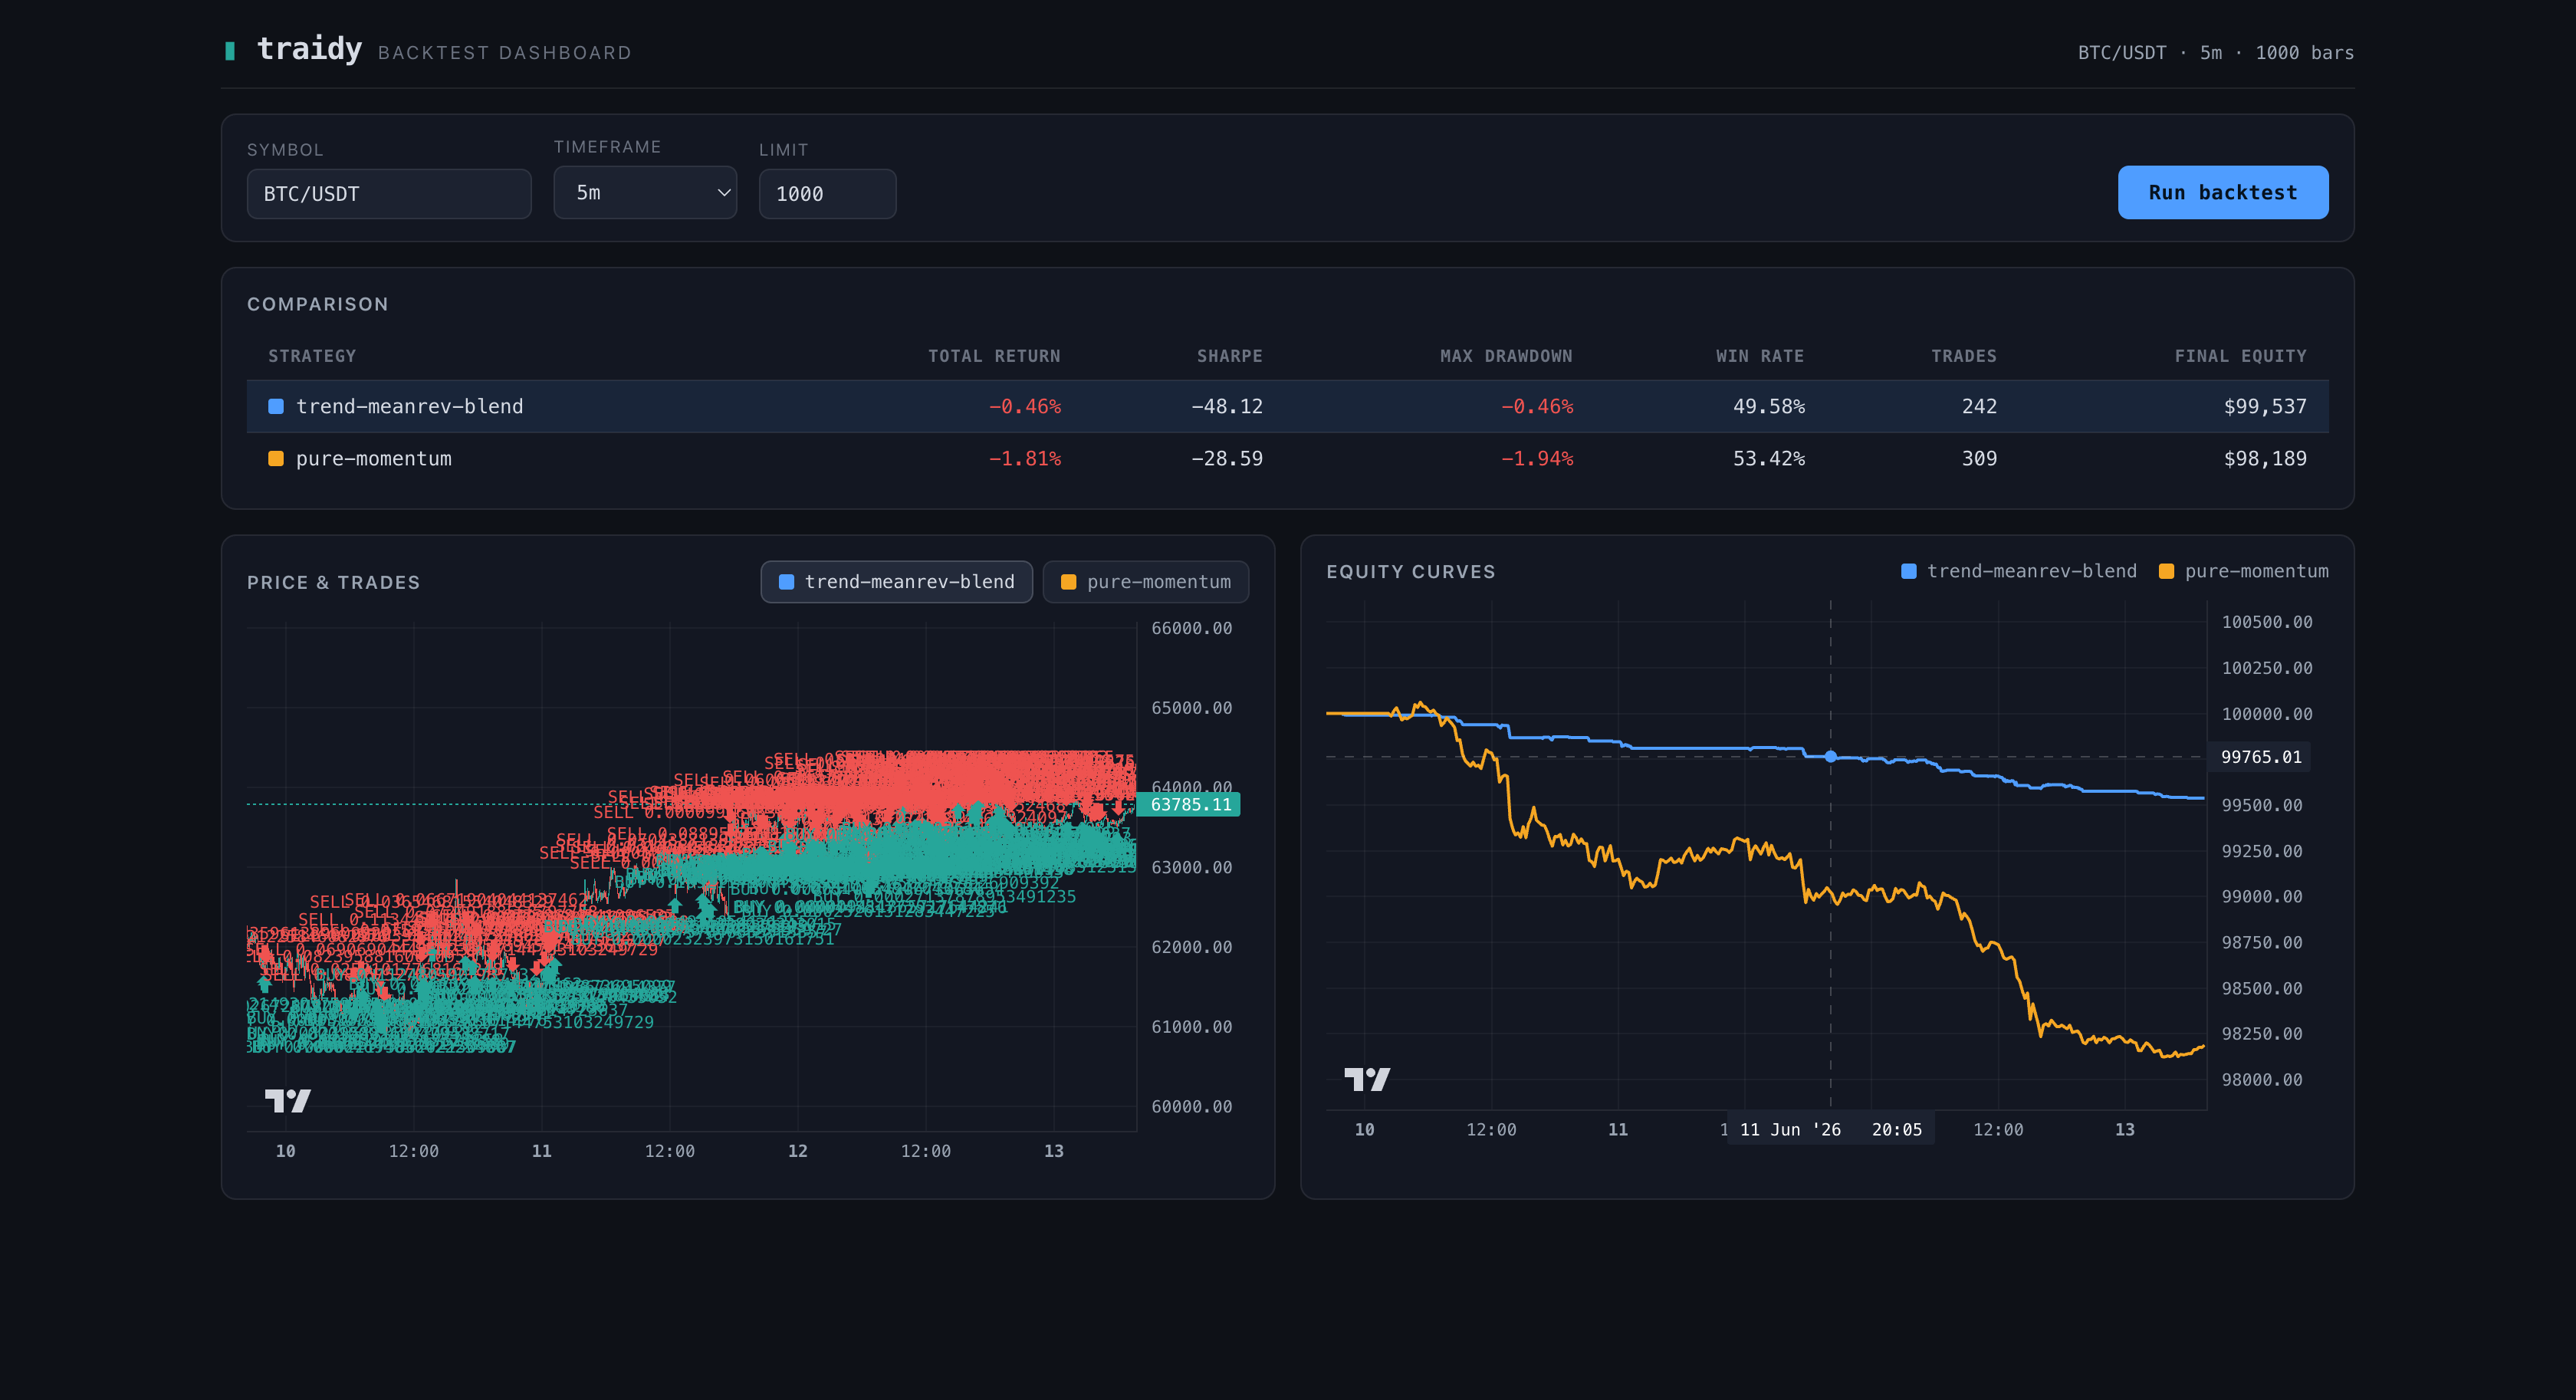
This is a screenshot of the Traidy Backtest Dashboard application showing a comparison of two trading strategies, 'trend-meanrev-blend' and 'pure-momentum', for the BTC/USDT symbol with a 5-minute timeframe and 1000 bars limit. The interface has a dark theme with blue and orange highlights. It displays strategy metrics including total return, Sharpe ratio, max drawdown, win rate, trades, and final equity. Two charts are shown: 'Price & Trades' with red and teal trade markers, and 'Equity Curves' with blue and orange lines representing each strategy's equity over time.
My role: Solo delivery
Project facts & technologies
Scale & delivery
- Team size
- 1 personRecorded project context
- Effort
- 16–20 person-daysBasis unspecified; not a delivery estimate
- Codebase size
- 10,171 source linesInspected source; may include team and inherited code
Working pattern: Evenings & weekends
Code measured 2026-11-18. Excludes comments, blanks and dependencies; test code counted separately.