
Traidy – Strategy Backtesting & News Data Research
Zuletzt aktualisiert:
Automatisch erstellte Bildbeschreibung
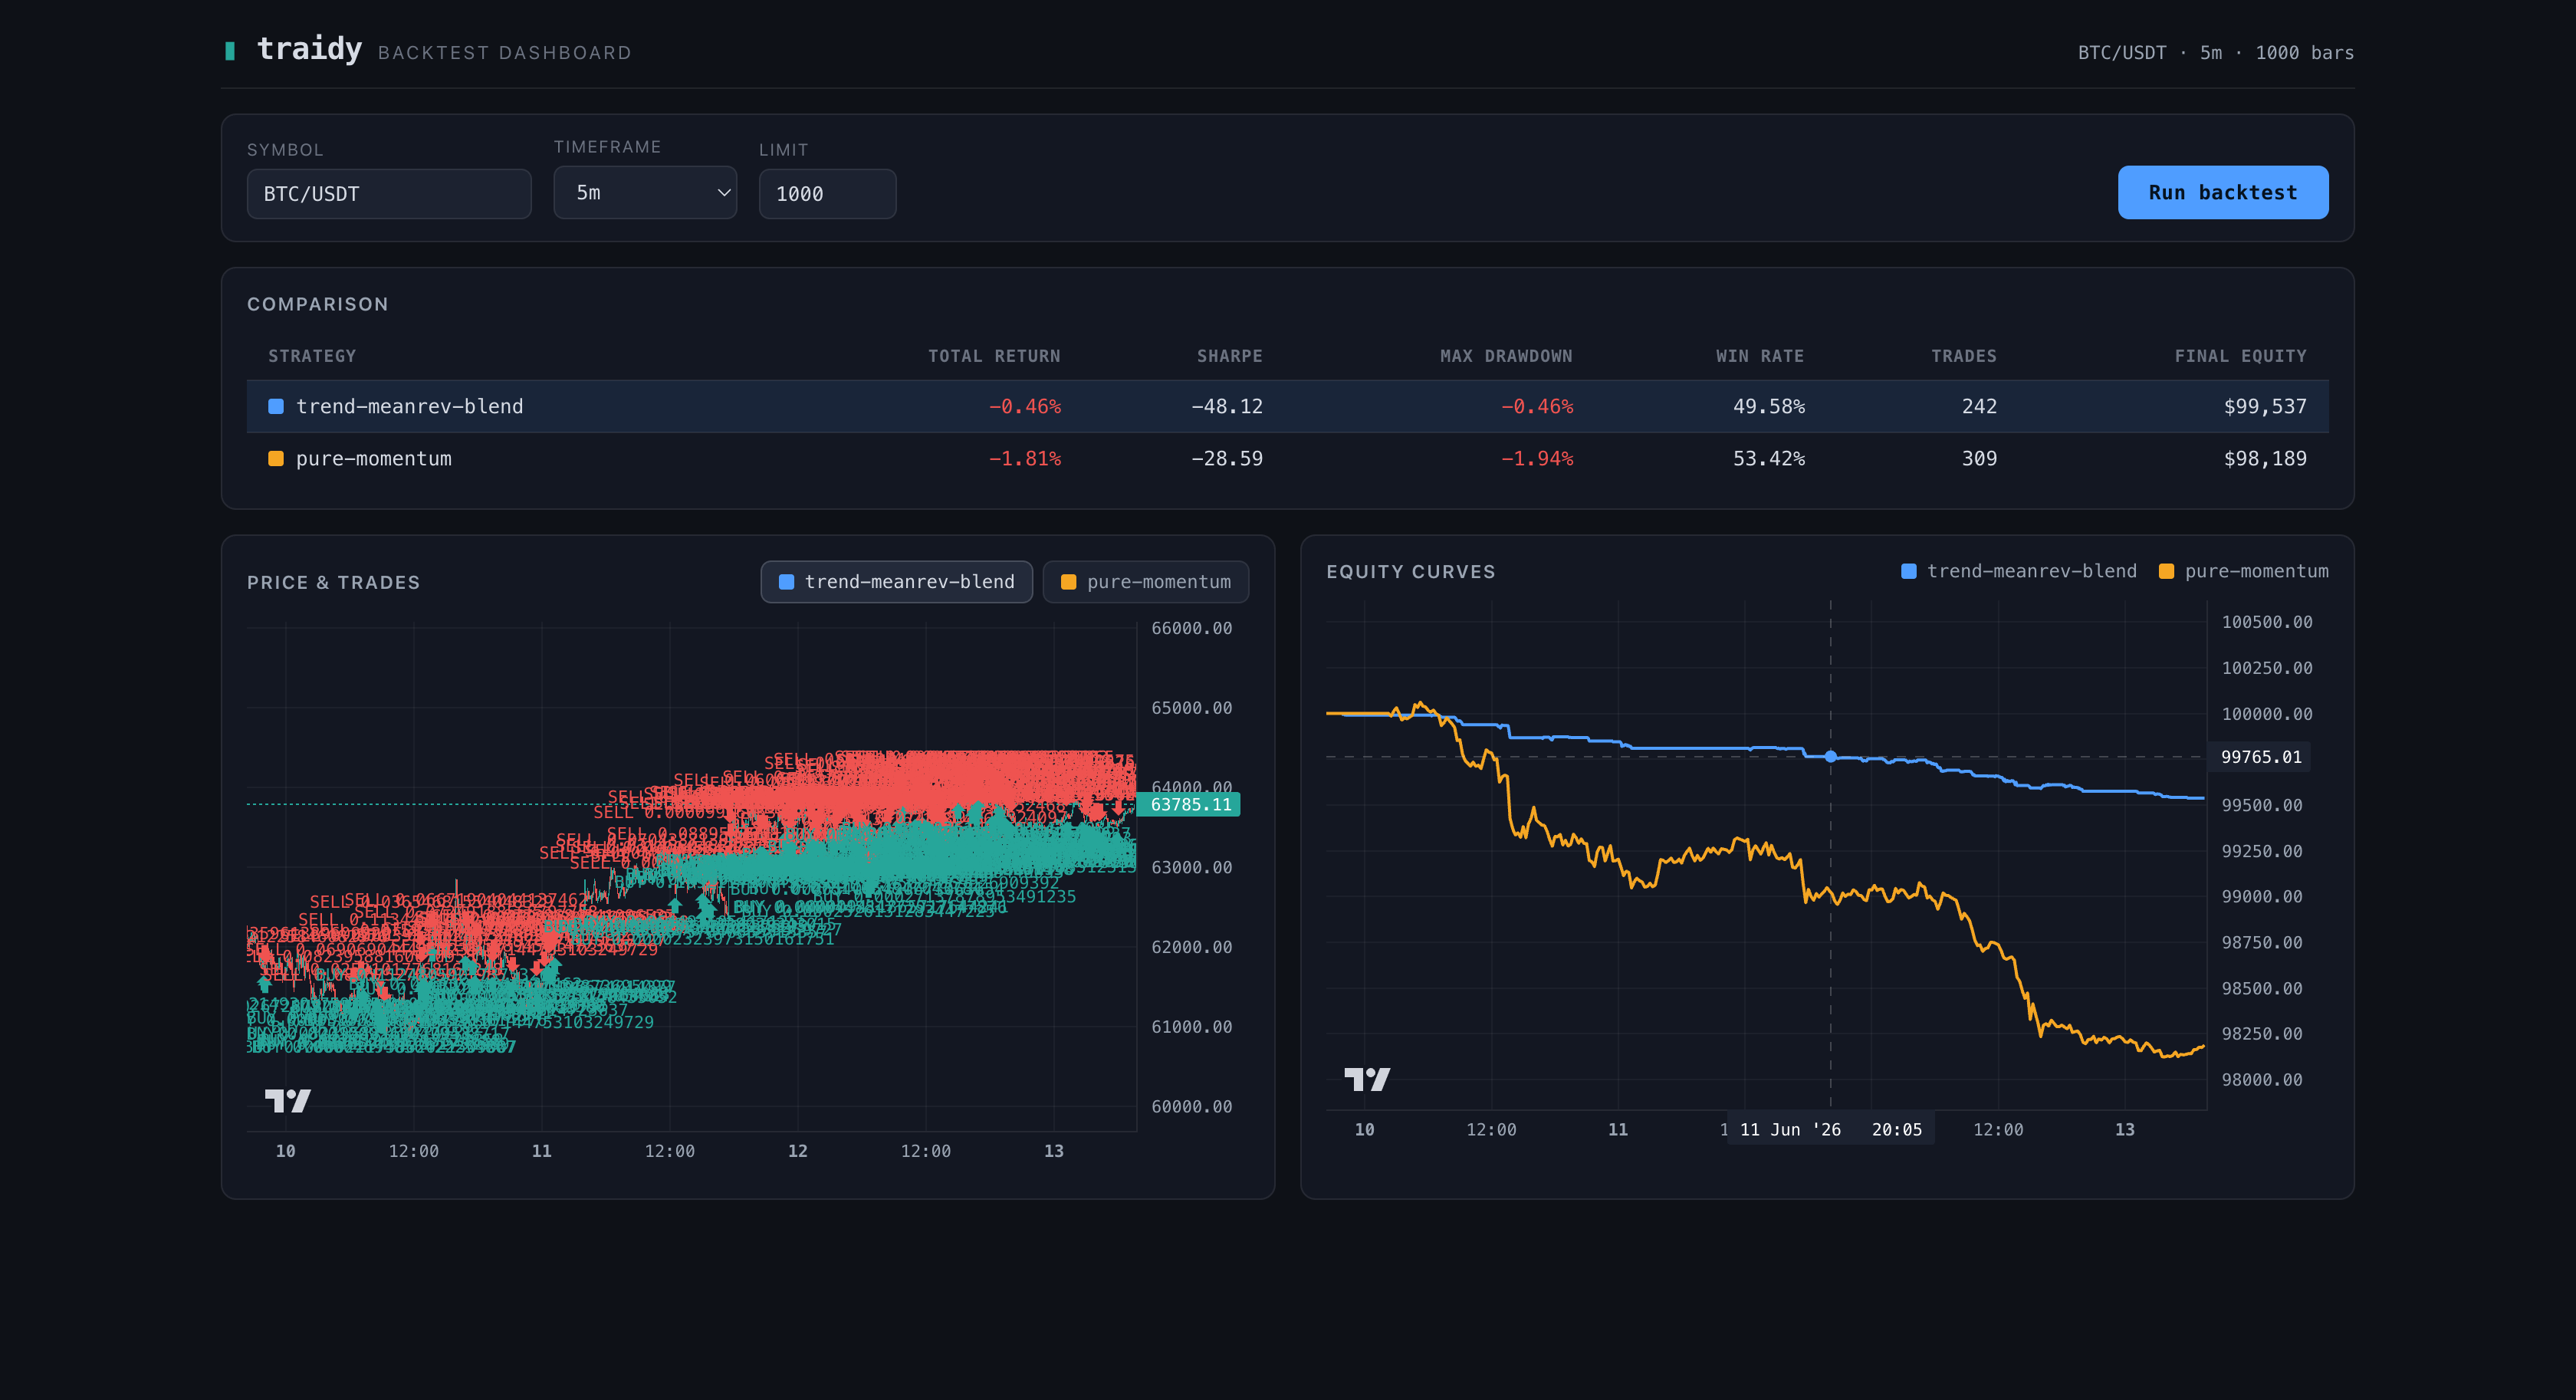
This is a screenshot of the Traidy Backtest Dashboard application showing a comparison of two trading strategies, 'trend-meanrev-blend' and 'pure-momentum', for the BTC/USDT symbol with a 5-minute timeframe and 1000 bars limit. The interface has a dark theme with blue and orange highlights. It displays strategy metrics including total return, Sharpe ratio, max drawdown, win rate, trades, and final equity. Two charts are shown: 'Price & Trades' with red and teal trade markers, and 'Equity Curves' with blue and orange lines representing each strategy's equity over time.
Meine Rolle: Eigenständige Umsetzung
Projektdaten & Technologien
Umfang & Zusammenarbeit
- Teamgröße
- 1 PersonErfasster Projektkontext
- Aufwand
- 16–20 PersonentageBasis nicht angegeben; keine Lieferzusage
- Codeumfang
- 10.171 QuellcodezeilenUntersuchter Code; kann Team- und bestehenden Code enthalten
Arbeitsweise: Evenings & weekends
Code gemessen am 2026-11-18. Ohne Kommentare, Leerzeilen und Abhängigkeiten; Testcode separat.