
Daily Briefing – Personal Information Aggregation Dashboard
Last updated:
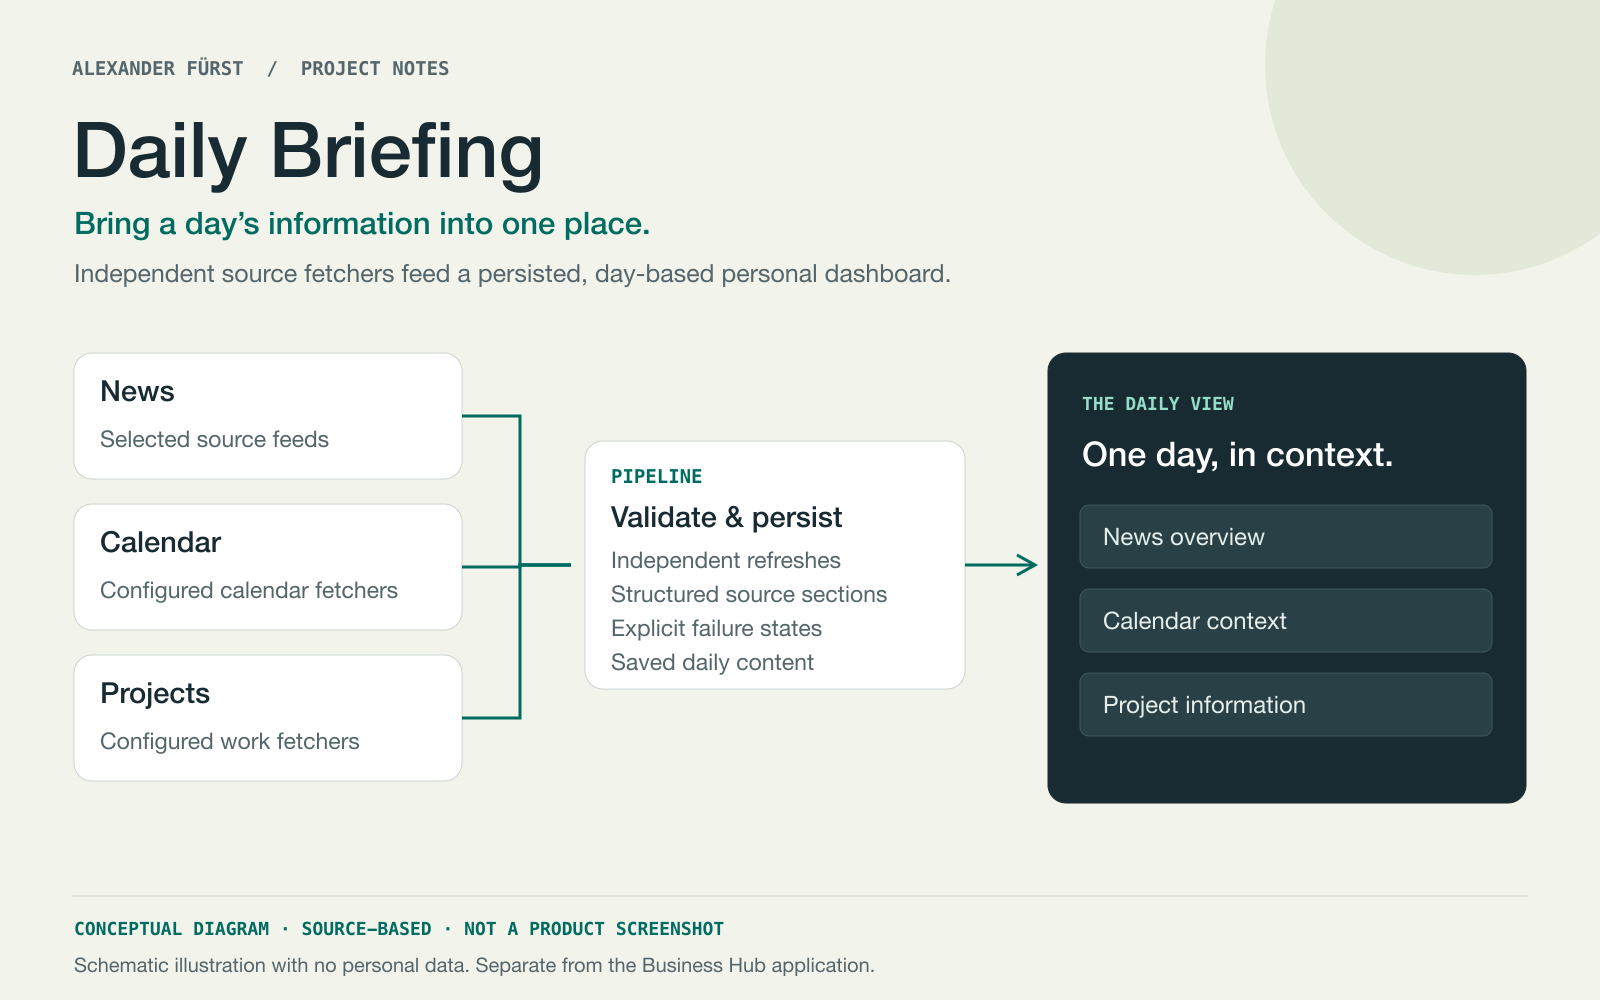
Automatically generated image description
Conceptual diagram titled 'Daily Briefing' showing a data flow process for aggregating daily information. On the left, three white boxes labeled 'News', 'Calendar', and 'Projects' represent independent source fetchers. Arrows point from these boxes to a central white box labeled 'Pipeline' with details on validation and persistence steps. Another arrow leads to a dark blue box on the right labeled 'The Daily View' containing three buttons: 'News overview', 'Calendar context', and 'Project information'. The background is light with minimalistic design and teal accent text.
My role: Solo delivery
Project facts & technologies
Scale & delivery
- Team size
- 1 personRecorded project context
- Effort
- 40–60 person-daysBasis unspecified; not a delivery estimate
- Codebase size
- 29,792 source linesInspected source; may include team and inherited code
Working pattern: Evenings & weekends
Code measured 2026-11-18. Excludes comments, blanks and dependencies; test code counted separately.